
CLIENT STORY / 01WORKING WITH BLAZE—IN THE CLIENT’S WORDS
Hear the experience directly from the client.
THE PEOPLE WHO PAID US HAVE THE MICROPHONE
Watch the founders. Read the original reviews. Open the dashboards. Then decide whether Blaze Ignite deserves a seat inside your business.
So don’t take our word for it.
Listen to the people who actually paid us.
Below are real Blaze clients, on camera, talking about what it is actually like having us inside their business.
No actors. No suspicious “John from Johannesburg” testimonials. No carefully rewritten marketing-department love letters.
Just founders. Their businesses. Their experience.
Hear the experience directly from the client.
Hear the experience directly from the client.
Hear the experience directly from the client.
We would rather you investigate us now than regret hiring another agency later.
The live feed below brings together Blaze Ignite reviews from Google and Facebook.
Steve de Villiers highlights Zain’s involvement, responsiveness and support for online-business growth.
STEVE DE VILLIERS · GOOGLE ↗Aubrey Williams praises the connected strategy, professionalism and creativity.
AUBREY WILLIAMS · GOOGLE ↗Tech Guru describes connected work across the website, ads and email for South African ecommerce.
TECH GURU · FACEBOOK ↗Different brands have different customers, margins, buying cycles, objections, products and economics.
We find what the customer needs to hear, what the store is leaking, what the economics can support and where the next profitable opportunity is hiding.
Then we build around that.



Big months. Smaller months. Orders. Fulfilment. Returning customers. The lot.
Because “data-driven agency” sounds very impressive until someone asks to see the actual data.
WELL… HERE IT IS. ↓
R1,974,224.00 in total sales. Orders and fulfilled orders both rose 102% against July 2025.
OPEN FULL-SIZE JULY DASHBOARD ↗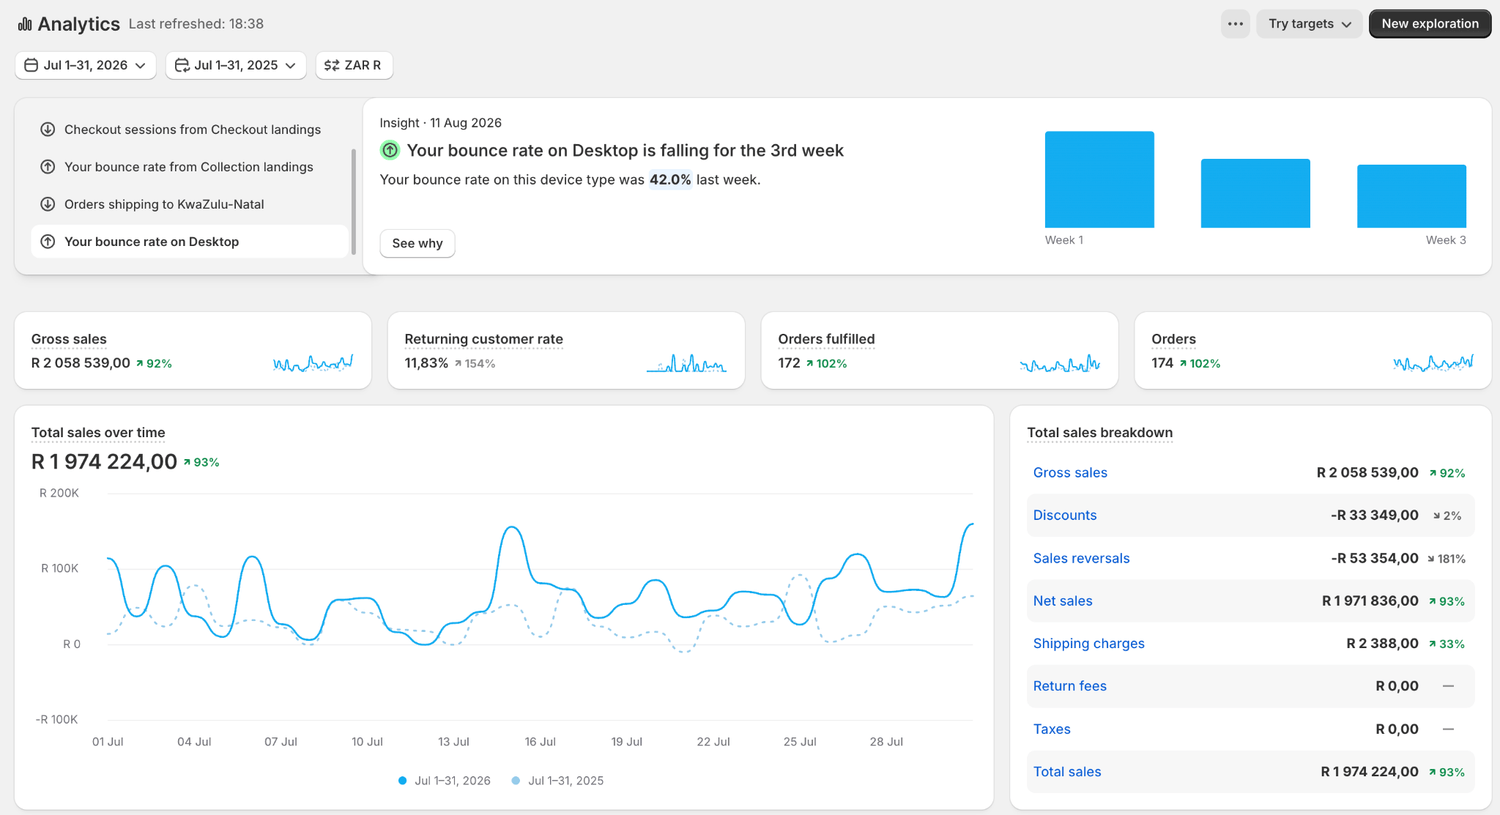
R1,881,742.25 in total sales. 164 orders, up 22%. Fulfilled orders rose 45%.
OPEN FULL-SIZE MARCH DASHBOARD ↗
R1,770,138.50 in total sales. Orders reached 155, up 115%. Fulfilled orders rose 93%.
OPEN FULL-SIZE NOVEMBER DASHBOARD ↗
R1,385,945.00 in total sales. Orders rose 99% and fulfilled orders rose 97% against June 2025.
OPEN FULL-SIZE JUNE DASHBOARD ↗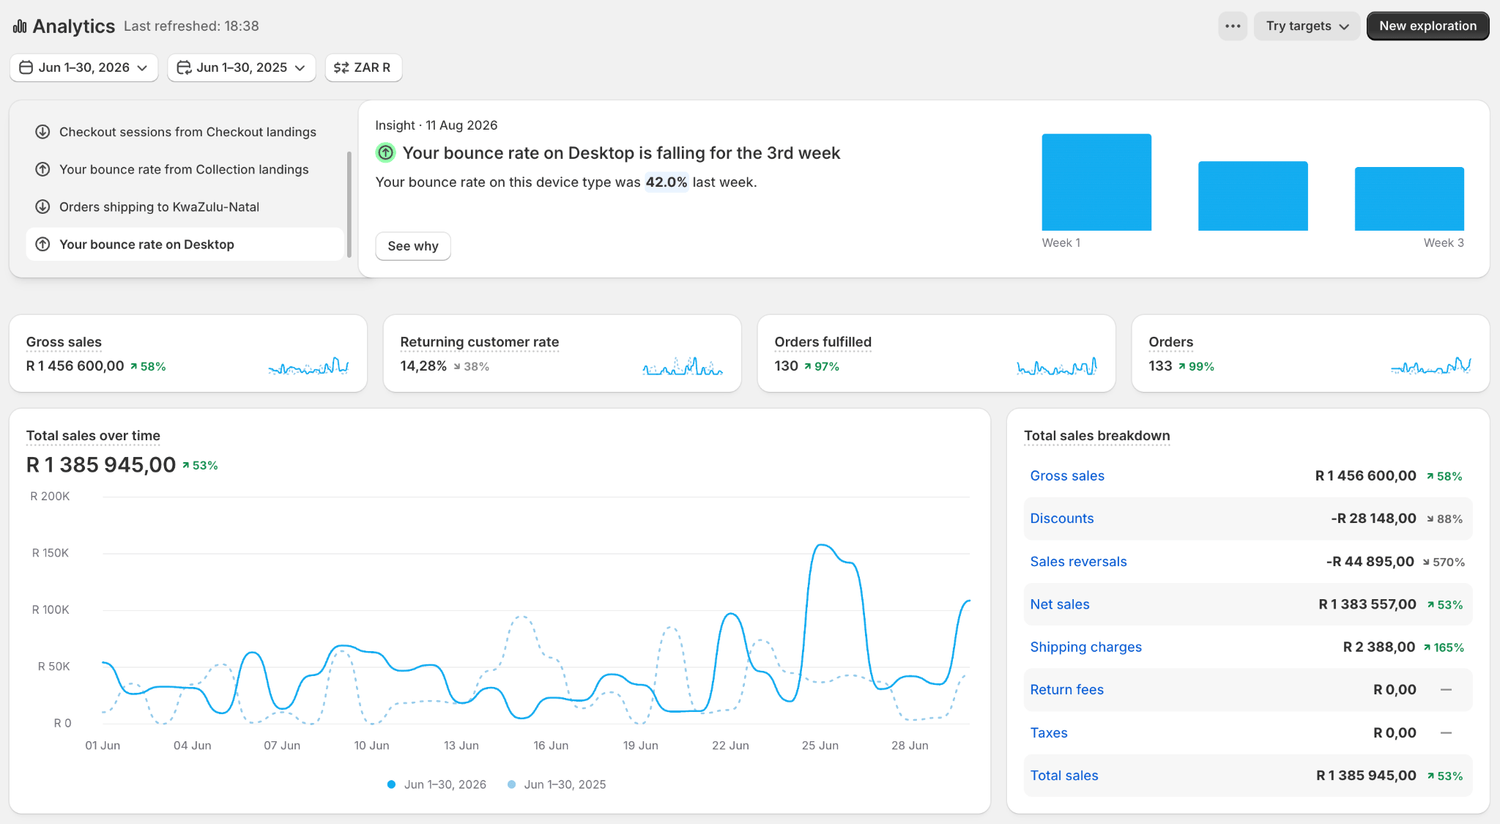
R1,247,782.50 in total sales. Orders and fulfilled orders both rose 68% against May 2025.
OPEN FULL-SIZE MAY DASHBOARD ↗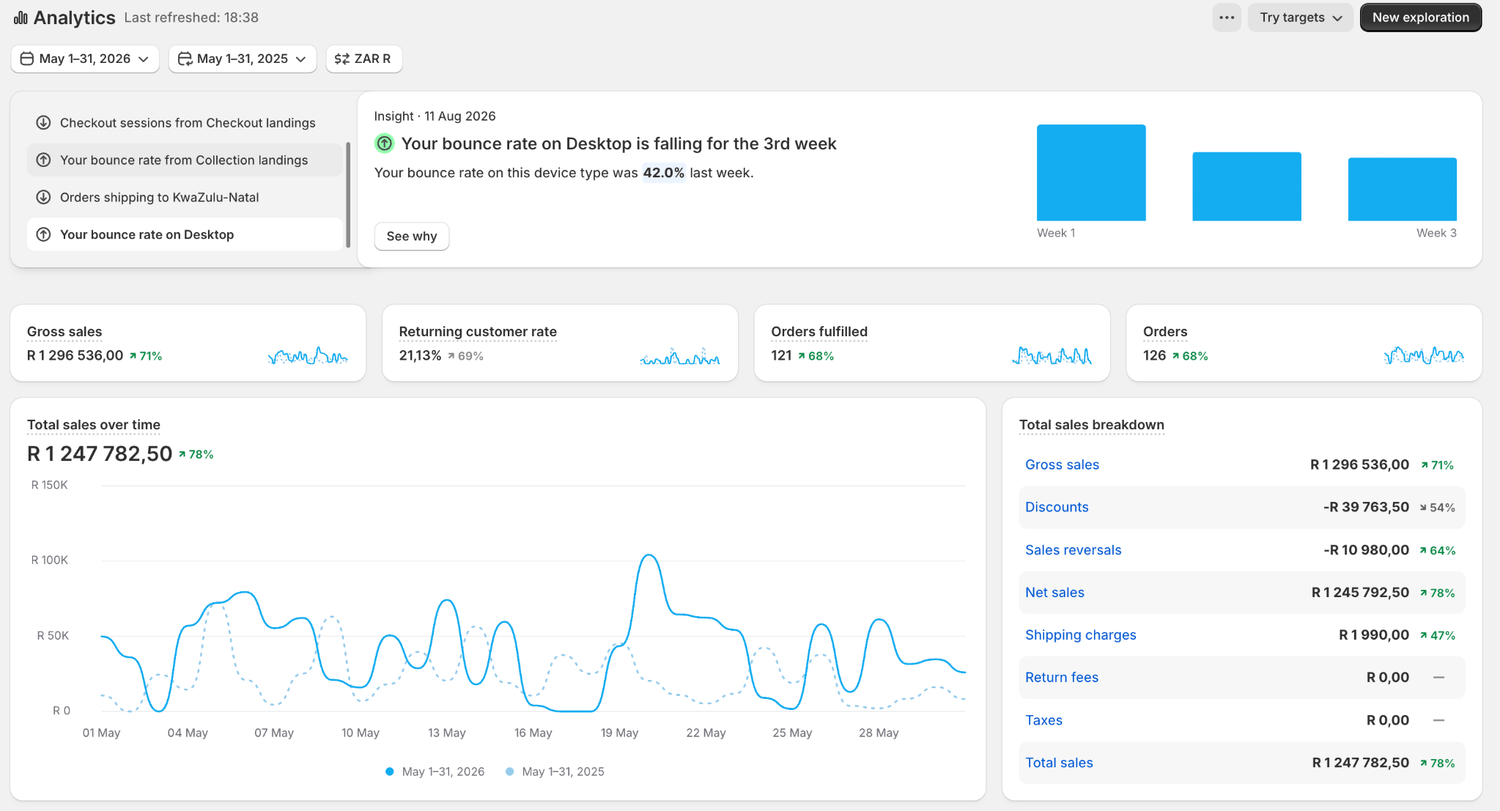
R1,008,567.89 in total sales. Fulfilled orders rose 15% against the displayed comparison range.
OPEN FULL-SIZE JULY DASHBOARD ↗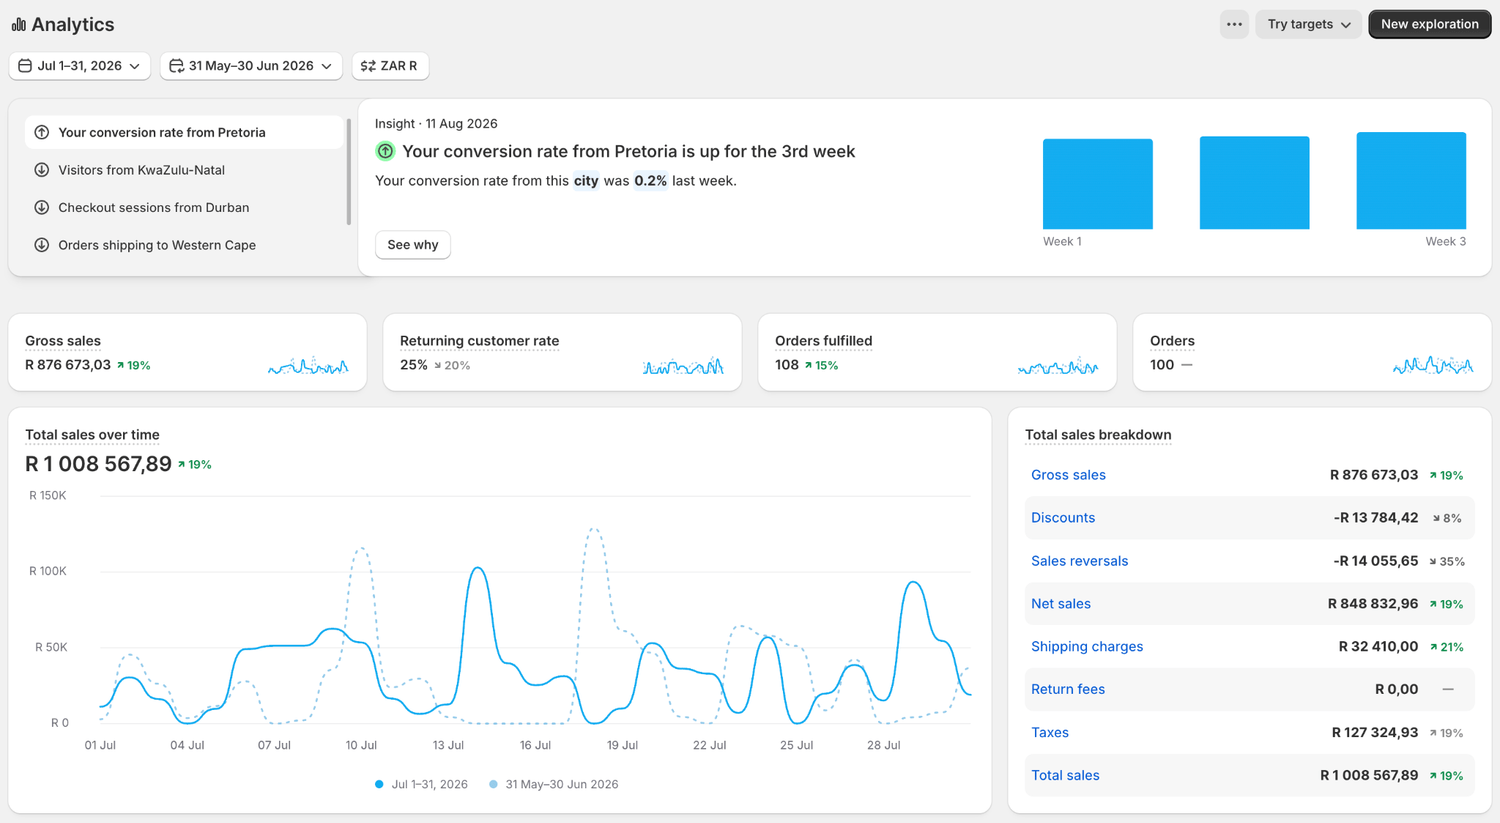
R1,411,856.00 in total sales. 129 orders, up 11%.
OPEN FULL-SIZE FEBRUARY DASHBOARD ↗
Start with the free 60-minute Growth Machine Audit™ and leave with a clearer commercial map for the business.